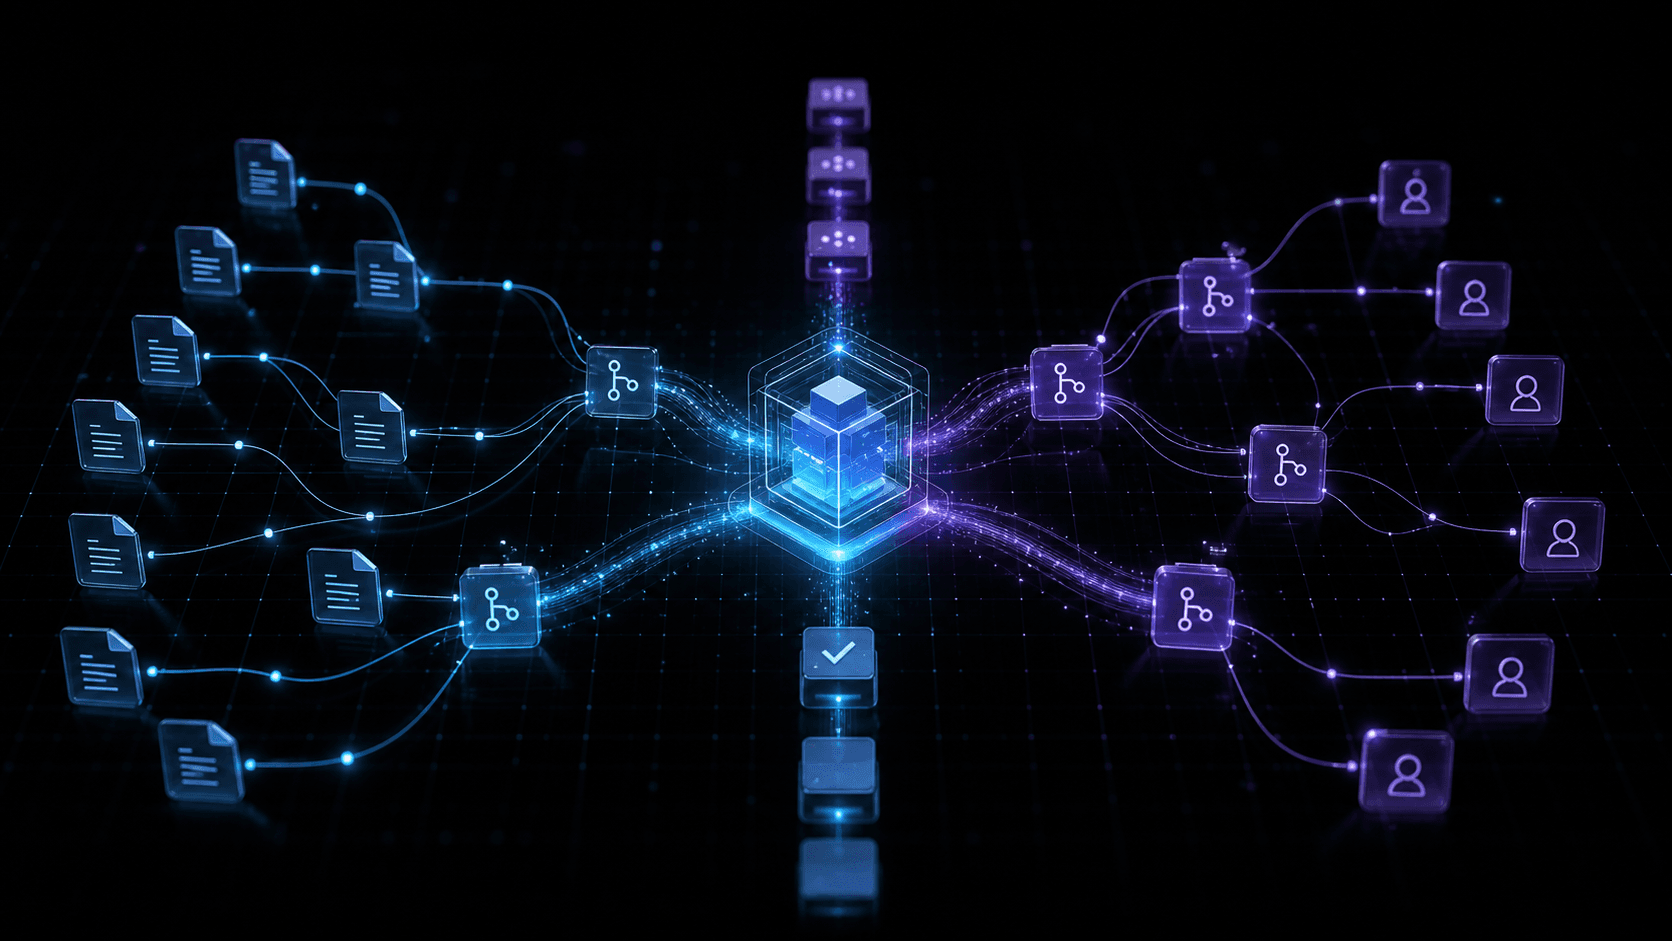
A repository is a record of code. GitHub is a record of work. Neither one, by itself, is a model of the software system your team is operating.
An Engineering Graph closes that gap. It represents repositories, services, files, dependencies, pull requests, decisions, incidents, tests, and people as nodes. Typed relationships explain how those things affect one another. Evidence attached to every relationship makes the graph inspectable instead of magical.
The result is not another dependency map. It is a queryable memory for the questions engineers ask every day: Why does this exist? What could this change break? Who understands it? What evidence says it is safe?
Start with questions, not a schema
The fastest way to build the wrong graph is to begin by importing everything GitHub can return. Start with the decisions the product should help someone make.
| Engineering question | Minimum useful path |
|---|---|
| What changed? | Pull request → commit → file |
| Who understands it? | File → reviewed by → person |
| What could break? | File → belongs to → service → depends on → service |
| Why does it exist? | Code → introduced by → pull request → implements → decision |
| Is it safe to ship? | Requirement → verified by → test → observed in → run |
These paths tell you which nodes and relationship types deserve to exist. They also define an early quality bar: if the graph cannot answer one of the target questions, more ingestion volume will not save it.
Build a canonical identity layer
GitHub data contains overlapping identities. A pull request references a repository, commits reference authors, review comments reference users, and file paths change over time. Without stable IDs, the graph quietly creates duplicates and contradictory histories.
Create a canonical key for every node:
Repository  github:{installation_id}:{repository_id}
PullRequest github:{repository_id}:pr:{number}
Commit      github:{repository_id}:commit:{sha}
File        github:{repository_id}:file:{normalized_path}
Person      github:user:{github_user_id}
Keep provider identifiers as properties, but do not use display names as identity. Names change. Database keys should not.
Separate observed facts from inferred structure
GitHub can directly support facts such as AUTHORED, REVIEWED, CHANGED, and MERGED_IN. Static analysis can support IMPORTS, CALLS, and DECLARES. Other relationships require inference.
For example, a person who reviewed eight changes to a payment service may have expertise. That does not prove formal ownership. Model the distinction:
(person)-[:REVIEWED {source: "github"}]->(pull_request)
(person)-[:HAS_EXPERTISE_IN {confidence: 0.78}]->(service)
Every edge should carry provenance, observation time, and confidence. This is what lets the interface say verified fact or inference honestly.
Ingest in layers
A useful ingestion pipeline usually has four passes:
- Repository history: repositories, branches, commits, pull requests, reviews, and comments.
- Code structure: files, modules, symbols, imports, API routes, dependencies, and tests.
- Organizational context: teams, ownership declarations, review patterns, and expertise signals.
- Operational evidence: incidents, deployments, alerts, architecture decisions, and agent execution events.
Each pass enriches the same canonical nodes. Do not build four disconnected search indexes and call the result a graph.
Preserve evidence on the edge
A relationship without evidence is a claim. A relationship with evidence is something an engineer can inspect.
{
  "type": "DEPENDS_ON",
  "from": "service:checkout",
  "to": "service:payments",
  "evidence": {
    "source": "src/checkout/client.ts",
    "line": 18,
    "observed_at": "2026-08-21T13:14:00Z",
    "extractor": "typescript-import-v3"
  }
}
That evidence becomes the bridge between a graph result and the source material. It also makes corrections possible. If an engineer rejects an edge, the system can preserve the correction instead of recreating the same bad inference during the next sync.
Query subgraphs, not the whole universe
The graph can contain millions of nodes. A useful answer should not.
Resolve the entities in the question, choose the relationship types that match the intent, traverse a bounded number of hops, and rank the resulting paths by evidence quality, directness, and recency. Give the language model that focused subgraph.
This pattern is why engineering graphs and agentic software fit together. The graph handles traversal and provenance. The model handles explanation. Neither is asked to impersonate the other.
The first version worth shipping
An MVP does not need every repository event. It needs one complete loop:
- connect a repository;
- ingest code and pull-request history;
- resolve files, services, dependencies, and owners;
- answer a small set of important questions;
- show the evidence behind every answer;
- learn when a user corrects the graph.
If that loop works, the graph compounds. Each merge, review, incident, and correction makes the next answer better. That is the difference between a diagram and an engineering intelligence system.
How to create knowledge graphs with generative AI
Google Cloud demonstrates how generative AI and Neo4j can help create knowledge graphs from connected data.